My Projects
Mes projets
- As a nerd, I'm always curious about which employers have the most vacancies (in data analysis field) in Canada. So, here it comes. This simple mini project is deployed based on the raw data extracted from Adzuna, which is a big third party job platform based in UK extracting and gathering data from other job webs, such as Indeed, Glassdoor and LinkedIn, etc. Furthermore, they supply the RESTful API, therefore, I can get the data in a clean and neat format (in JSON) in a safe and efficient way comparing to other methods, such as web scraping (web scraping gets raw html and sometimes faces to the problems of copyright / legality, etc. - it's annoying in one word). The most important thing is - it's free. Actually there is no "analysis" in this project - Aduzna will do these in their server end and spit out the results. What I need to do is just accessing their endpoint in the server via a GET request (as in HTTP), extract these results, parse them from JSON into data frame, visualize, and then save them into a csv file. Alors, c'est parti!
- Register and get an API credential on Adzuna API
- Get the endpoints for "Top companies" in Canada - an endpoint is like a "web address" (url), there are 9 endpoints in Adzuna for different functionalities, ex. get job list in certain area; get top companies; get salaries, etc. (what I need now is "get top companies"). As per Adzuna, this endpoint returns a "leaderboard" of the top five employers by number of vacancies. I can filter for specific locations and/or job titles
- Get familier with the parameters defined in that endpoint - what I used was just "what" parameter (what = 'data%20analyst'), '%20' in here represent a space character. But if I want a more specific location, say I want to find out Top 5 employers for Java developer with # of vacancies in Ontario, just make what = 'java%20developer', location0='Canada', location1='Ontario' (by default, location0='Canada' when we select country = 'ca')
- In Python (I used Jupyter Notebook), set up the url including the parameters, in my case:
url = f'https://api.adzuna.com/v1/api/jobs/ca/top_companies?app_id={APP_ID}&app_key={APP_KEY}&what={WHAT}' - Make a request to GET an http response via the url
- IF response code == 200, access the value of the key "leaderboard" in a dictionary (key-value pair in json) and convert into data frame (in Pandas) with 2 columns "company_name" and "count", ELSE return error code
- Save this data frame into a CSV file
- Plot the results in a bar chart (or simply insert a chart in Excel)
- Done!
						# Created by Han Zhang (you can copy it but pls put my name on it, if it doesn't work for you, email me)

						import requests

						import csv

						import pandas as pd

						import matplotlib.pyplot as plt

						APP_ID = YOUR_ID

						APP_KEY = YOUR_KEY

						# Define the job to search

						WHAT = 'data%20analyst'

						# File to store results

						csv_file = 'top_companies.csv'

						url = f'https://api.adzuna.com/v1/api/jobs/ca/top_companies?app_id={APP_ID}&app_key={APP_KEY}&what={WHAT}'

						# Make the API request

						response = requests.get(url)

						if response.status_code == 200:

						    data = response.json()

						    # Parse JSON and extract the leaderboard data

						    leaderboard = data['leaderboard']

						    # Convert leaderboard data to a DataFrame

						    df = pd.DataFrame(leaderboard)

						    # Save the DataFrame to a CSV file

						    output_file = "Top_Companies.csv"

						    df.to_csv(output_file, index=False)


						    print(f"Data saved to {output_file}")

						    # plot the data in bar chart

						    if not df.empty and 'canonical_name' in df and 'count' in df:

						        plt.figure(figsize=(10, 6))

						        bars = plt.barh(df['canonical_name'], df['count'], color='skyblue')


						        # Add labels and title

						        plt.xlabel('Count', fontsize=12)

						        plt.ylabel('Company Name', fontsize=12)

						        plt.title('Top Companies by Count of Job Vacancy (data analyst) - valide at 2024-12-10 12:55', fontsize=14)

						        plt.gca().invert_yaxis()  # Invert the Y-axis for better visualization


						        # Add data labels next to each bar

						        for bar in bars:

						            width = bar.get_width()

						            plt.text(width + 0.2, bar.get_y() + bar.get_height()/2, str(int(width)),

						                     va='center', ha='left', fontsize=10, color='black')


						        # Show the plot

						        plt.tight_layout()

						        plt.show()

						    else:

						        print("DataFrame is empty or required columns are missing.")

						else:

						    print("DATA WAS NOT EXTRACTED, ERROR CODE: " & response.status_code)
Here is the result - Top 5 companies with # of vacancies for data analyst in Canada. (Please note that your result might be different than mine if you run at a different time or day.)
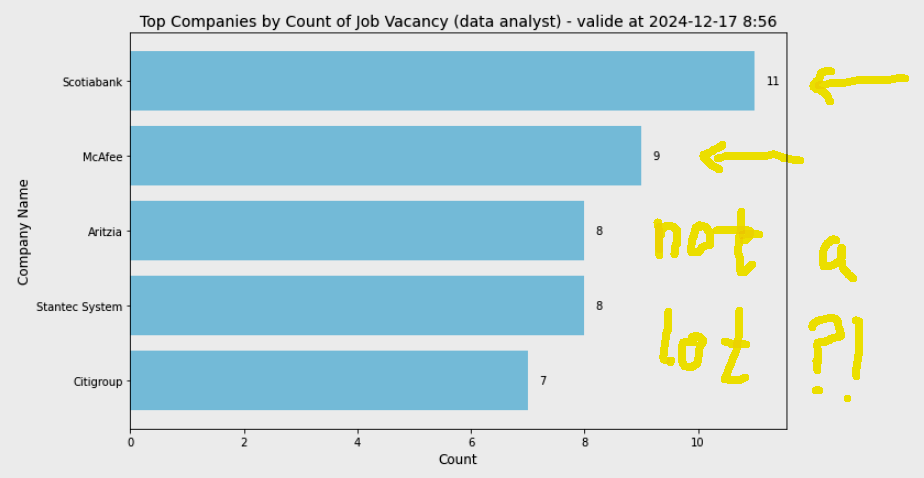
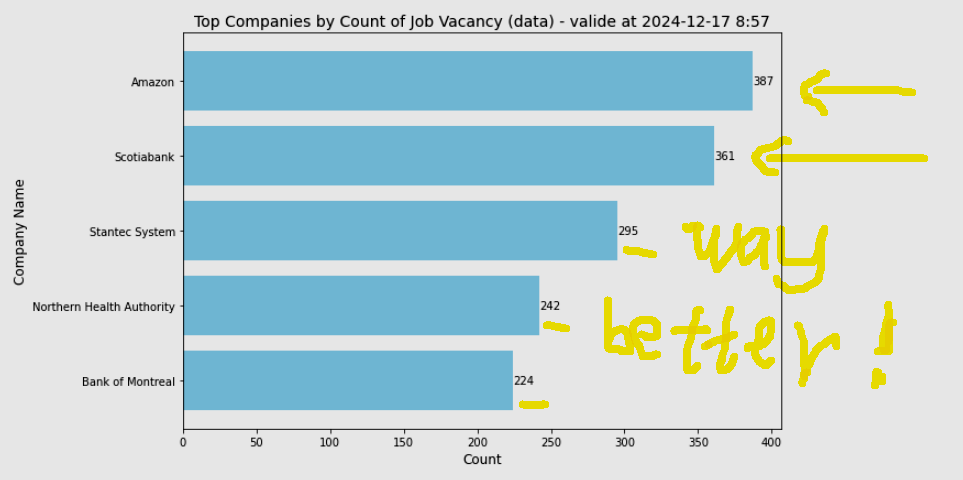
The result is very interesing. The top company has just less than 20 vacancies in the entire country makes me doubt it. I don't know how Adzuna handles the natural language, but my experience on Google search tells me "the less key words the more results". So I just put "data" instead of "data analyst". The result proves that I was right. But that brings another problem - it' too vague. Data what? Tons of jobs are related to data. In conclusion, both are correct, if I search "apex developer for just salesforce platform", maybe I'll get 0 result. The key point is to define the purpose of our analysis in advance and to find out a "tolerance point".
Anyway, this is a method (first step) to play the Adzuna API, it's still in a abstract level. I will dig into that to explore more.
References:
[1] Adzuna API (https://developer.adzuna.com/overview)
[2] RedHat (https://www.redhat.com/en/topics/api/what-is-a-rest-api)