My Projects
Mes projets
- I decided to create this project to have a peek on the job supplies and categories in target cities in Canada (Sherbrooke, Montreal, Quebec City, Toronto, Vancouver, Calgary, Halifax), in a certain period by the construction of a simple data pipeline.
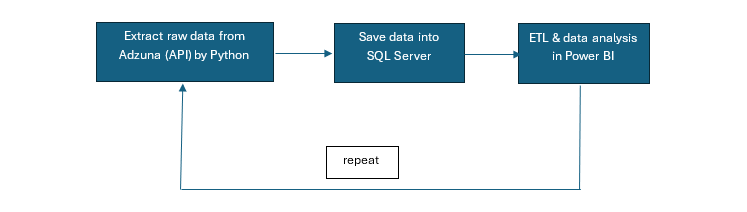
The raw data is extracted from Adzuna API in Python. (Adzuna is a third-party job platform collecting & integrating dada from other platforms, such as Indeed, LinkedIn, etc.) This is an ongoing project, the raw data is updated every Friday (started from 2024-11-22), it will be saved in the SQL Server on my local PC. Then ETL will be applied to the data in Power Query. In the end, the data will be analyzed and visualized in Power BI. So here I've created a simplest toy of data pipeline in the world. It's also a "trial and error" project, which means the algorithm will probably be adjusted and updated based on the results accordingly. This project is different than the "Top 5 companies in Canada for data analyst", where the analysis is done by the server of Adzuna, in this project all the analysis will be done by myself. Adzuna API will just supply the raw data. The following diagram shows the general procedures of this project.
Jobs will be categorized into several groups, for example, IT, Engineering, Accounting & Finance, Sales, etc. (there are 30 categories in Adzuna). In the end, the results will show the percentage of each category in a city, say, in the past week, among the 2000 random samples (job posts) from Montreal, 40% of the job falls into customer service; 30% falls into financial services; 20% falls into IT, etc.
1. Extract raw data from Adzuna API by Python
Adzuna uses RESTful API, which means in my computer, I will send a REQUEST to the server of Adzuna via an endpoint (URL) where the parameters are integreated, as shown in the following screenshot:
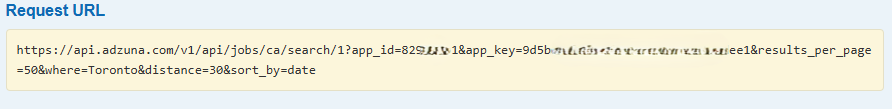
This is just an example that I did manually on Adzuna API, where I extracted the data from the first page (50 records) of Toronto in a radius of 30km, then sort them by date. But in order to extract enough data from all 7 cities (not just from the 1st page of Toronto), automation must be applied in loops in Python.
The RESPONSE I will get from the server is shown in the following screenshot:
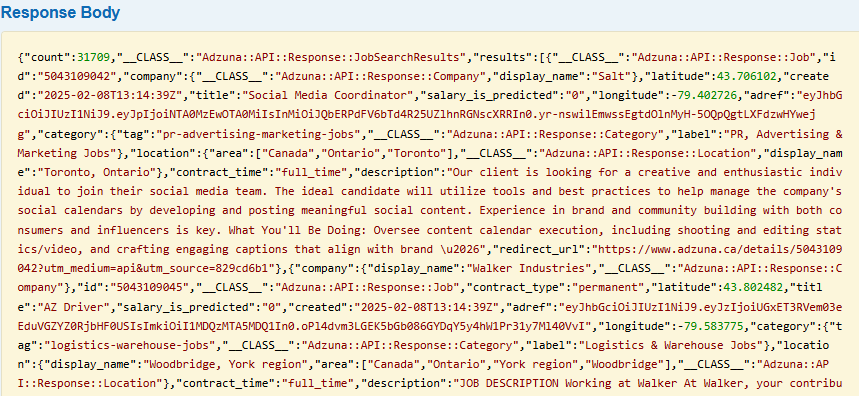
As shown above, the data is saved in key-value pairs, I will use the GET() method to extract the values, then save them into the database in SQL Server by INSERT INTO queries under a CURSOR.
Another key thing to clarify in this step is the sampling technique. Big and random samples will give me a good understanding of the job market with as little bias as possible. Given the population of my target cities differ a lot, choosing a same sample size (for example 1000) will probably exhaust all job posts in that period in small cities like Sherbrooke, but will be a bit small and not representitive enough for big cities like Toronto. Therefore, I will use proportional sampling technique. One thing to consider is that jobs posted in Quebec province are in French (some are in English), when parsing the website, keep an eye on some relevant keywords to see if they need to be adjusted. Here comes the detail:
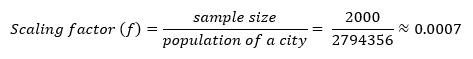
- Set up a maximum cap for the largest city – Toronto, say 2000 job posts. (Why 2000? - as per Adzuna API, started from 2024-11-22, the total job posts of Toronto (within 30 km radius) in the past 7 days are 5197. Let's suppose Adzuna can cover all the job posts in that week in Toronto, then 5197 is the “population” in statistics from 7 days ago till that day, so 2000 sample data represents 38% of the entire jobs, which is a good enough.) In addition, this sample size would still reflect job diversity but with fewer API calls considering the tradeoff between the dada sampling and traffic on the server of Adzuna.
- Calculate the scaling factor. Say the population of Toronto city is approximately 2,794,356 according to Statistics Canada of 2021 Census of Population
- Apply this factor (f = 0.0007) to other cities to get the sample size:
Montreal, QC – 1762949 × 0.0007 ≈ 1262,
Calgary, AB – 1306784 × 0.0007 ≈ 935,
Vancouver, BC – 662248 × 0.0007 ≈ 474,
Quebec City, QC – 549459 × 0.0007 ≈ 393,
Halifax, NS – 439819 × 0.0007 ≈ 315,
Sherbrooke, QC – 172950 0.0007 ≈ 124
let me define sample size of each city using a dictionary comprehension (for loop in key-value pair of a dictionary)
city_population = {
    'Toronto,ON': 2794356,
    'Montreal,QC': 1762949,
    'Calgary,AB': 1306784,
    'Vancouver,BC': 662248,
    'Quebec City,QC': 549459,
    'Halifax,NS': 439819,
    'Sherbrooke,QC': 172950,
}
samples_per_city = {city: min(int(pop * scaling_factor), toronto_cap) for city, pop in city_population.items()}
the results will be like:
{'Toronto,ON': 1999, 'Montreal,QC': 1261, 'Calgary,AB': 935, 'Vancouver,BC': 473, 'Quebec City,QC': 393, 'Halifax,NS': 314, 'Sherbrooke,QC': 123} - Confirm page number of each city (pagination). The sample size of each city has been confirmed in previous step. However, in Adzuna API, only the data in the first page will be pulled by default, and one page can have at most 50 records, which is apparently not enough.
So we will need to configure the "page" and “results_per_page” parameters in Adzuna. Here “page” refers to the page number, it can be integers like 1 or 2, etc.. And “results_per_page” indicates the number of job posts in one page.
By default, it’s 20, and the maximum number is 50. So, for a city like Toronto with sample size 2000. If I have 50 “results_per_page”, then I’ll need to pull 40 pages. (Here I can consider using a for loop in Python). Let me generalize it as:
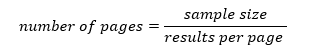
If the “results_per_page” is 50, here comes the number of pages of each city (let’s round it up):
Number of pages (Toronto) = 2000 ÷ 50 = 40,
Number of pages (Montreal) = 1262 ÷ 50 ≈ 26,
Number of pages (Calgary) = 935 ÷ 50 ≈ 19,
Number of pages (Vancouver) = 474 ÷ 50 ≈ 10,
Number of pages (Quebec City) = 393 ÷ 50 ≈ 8,
Number of pages (Halifax) = 315 ÷ 50 ≈7,
Number of pages (Sherbrooke) = 124 ÷ 50 ≈3
For this part, a for loop likefor page in range (1, total_pages + 1):together with a proper URL such asapi_url = f'https://api.adzuna.com/v1/api/jobs/ca/search/{page}'will solvoe this issue, where thepageis the looping variable. So to start up, I will get a job list of the past 7 days from 2024-11-22 of the selected cities, each has the sampling job posts pulled from page 1 to the calculated page as shown above. This is just a starting point, then follow up with weekly pulls (every Friday) for ongoing data collection, which will give me some insights into how the job market evolves over time (I will have time series analysis in the future). This approach avoids the heavy overhead of daily pulls but is still detailed enough to capture changes in the job market. - Set up the API parameters in Python and pull the data. With those key factors confirmed in the previous steps, it's time to set up the parameters. In Aduzna (actually in HTTP protocal), some parameters work as authentication, such as APP_ID and APP_Key (the ID and Key in Adzuna), some work as filters to generate the filtered results as we need. The parameters can be inserted or appended to the base endpoint (URL). The original base endpoint looks like:
https://api.adzuna.com/v1/api/jobs
This base URL is same for all endpoints for accessing job listing. On top of that I have /ca, which indicates the country code (Canada in this case). Then I have /search/1 representing the search end point and page number (first page in this case). Then a question mark ? indicating the beginning of the query string, where the parameters are appended after that. Till now, the endpoint is like:
https://api.adzuna.com/v1/api/jobs/ca/search/1?
As discussed above, 1 page is not enough to get the samples, so I’ll use a for loop to pull the data on the number of pages in each city as in 1.4. Other than that, we got following parameters to be appended after the question mark “?”:params = { 'app_id': APP_ID, 'app_key': APP_KEY, 'where': city (use a for loop to loop through ‘Toronto, Montreal, Vancouver, etc.) 'results_per_page': RESULTS_PER_PAGE, (here I set 50 – the max of Adzuna) 'max_days_old': MAX_DAYS_OLD, (since I’ll pull every week, so it’s 7) 'distance': DISTANCE, (it’s the distance to the city center in km, I set 30) 'sort_by': SORT_BY (I set sort by date – the most recent records will be put on top) }When I attach the parameters in the URL, I’ll make a request to GET the results:
response = requests.get(api_url, params=params)
Combining the parameters as above, it will look like:total_pages = math.ceil(sample_size / 50) jobs = [] for page in range (1, total_pages + 1): api_url = f'https://api.adzuna.com/v1/api/jobs/ca/search/{page}' params = { 'app_id': APP_ID, 'app_key': APP_KEY, 'where': city, 'results_per_page': RESULTS_PER_PAGE, 'max_days_old': MAX_DAYS_OLD, 'distance': DISTANCE, 'sort_by': SORT_BY } response = requests.get(api_url, params=params)The returned results will be in the format of JSON, I’ll need to extract the value in the ‘key’- ‘value’ pair. The outputs I will get is as following:
Company name ("company",{"display_name":); Job title ("title"); Job Category ("Category","label":) (such as IT/ Accounting/Financial Services, etc.); Location (province, city)("location","area":); Education (required degree, such as bachelor in computer science); contract_time (full / part time) ("contract_time"); Contract type ("contract_type"); Salary ("salary_max", "salary_min"); Publish date ("created");Description("description":) then put them into SQL Server database. So here comes the next part …
2. Save data into SQL Server
After pulling the raw data, I'll save them into SQL Server database. The first thing I need to do is to CREATE DATABASE. Since I’ve got the key-value pair of each object in the previous step, now I’ll need to CREATE TABLE with the column names similar as the ‘key’ in the JSON format data, for example, in the table, I need to have columns: company_name, job_tittle, job_category, province, city, etc, which are equivalent to the "company"."display_name", "title", "category"."label", "location"."area"[1], "location"."area"[2]. etc. as in the JSON format data as I got in the previous step. Here I'll use .get() function to access the values.
One thing to be very careful is that the number of columns in the table of SQL Server should be same as what I've pulled from the JSON format data from Adzuna and they should have the same data type, otherwise they won't be strored into the database.
This is the code I wrote to creat database and table in SQL Server (the DBMS is on my own PC at home):
-- this code will create a database and a table to save the data pulled from Adzuna API

CREATE DATABASE job_data_DB;

use job_data_DB;

CREATE TABLE dbo.job_list (
	id_sk int identity (1,1),   -- this is a surrogate key starting from 1
	job_id nvarchar(255),            -- this is a real job id from the web
	company_name nvarchar(255),
	job_title nvarchar(255),
	category nvarchar(255),
	province nvarchar(255),
	city nvarchar(255),
	contract_time nvarchar(255),
	contract_type nvarchar(255),
	salary_min float,
	salary_max float,
	publish_date datetime,
	job_description nvarchar(max),
	job_count int)
This is the code I wrote to parse JSON file and save them into database:
connection_string = (
"Driver={ODBC Driver 17 for SQL Server};"
"Server=SERVER_NAME;"  # my server name, e.g., "localhost" or "192.168.1.100"
"Database=DATABASE_NAME;"
"Trusted_Connection=yes;"
)

    try:
        conn = pyodbc.connect(connection_string) # connect to SQL server
        cursor = conn.cursor()

        for job in jobs:
            cursor.execute('''
                INSERT INTO dbo.job_list (job_id, company_name, job_title, category, province, city,
                contract_time, contract_type, salary_min, salary_max, publish_date, job_description,
                total_job_count)
                VALUES (?, ?, ?, ?, ?, ?, ?, ?, ?, ?, ?, ?, ?)
                ''',
                job.get('id'),
                job.get('company', {}).get('display_name'),
                job.get('title'),
                job.get('category', {}).get('label'),
                job.get('location', {}).get('area', [None, None])[1],
                job.get('location', {}).get('area', [None, None])[2],
                job.get('contract_time'),
                job.get('contract_type'),
                job.get('salary_min'),
                job.get('salary_max'),
                job.get('created'),
                job.get('description'),
                jobs_count)

        conn.commit()
        print(f"Successfully saved {len(jobs)} job(s) to the database.")

    except pyodbc.Error as e:
        print(f"An error occurred: {e}")

    finally:
        cursor.close()
        conn.close()
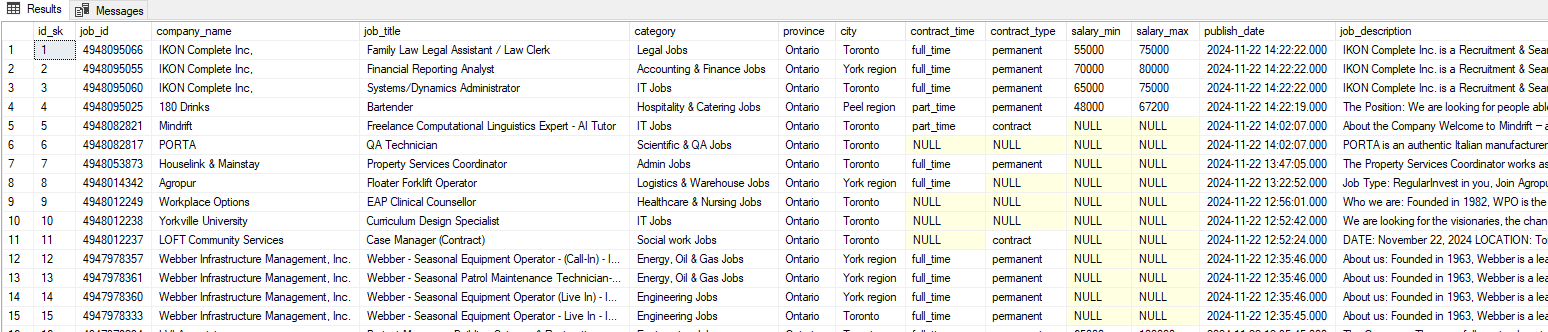
This is a sample of data saved into SQL Server pulled from Adzuna API:
3. ETL & data analysis in Power BI
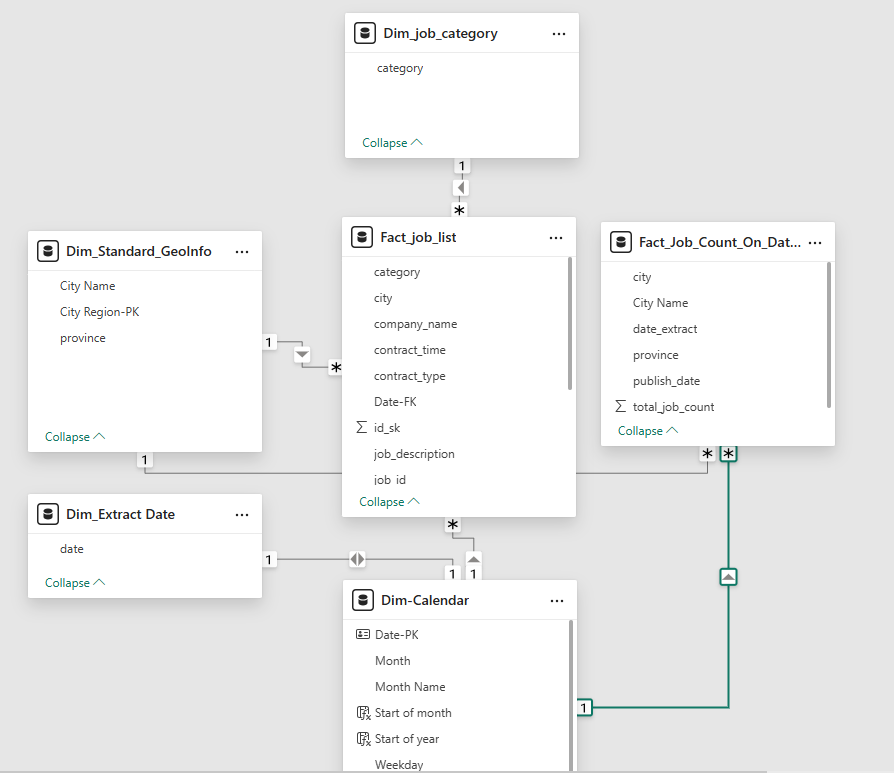
Till now, the raw data is saved in SQL Server on-premises (on my own PC). Then I imported them via Power Query in "import mode" and transformed them to get the clean and ideal formatted data with the features that I need. I used the "import mode" because it's not a huge dataset, and I don't need to update frequently. Based on the original imported query I've also created fact tables and dimension tables for the star schema in the model in PBI. As shown below:
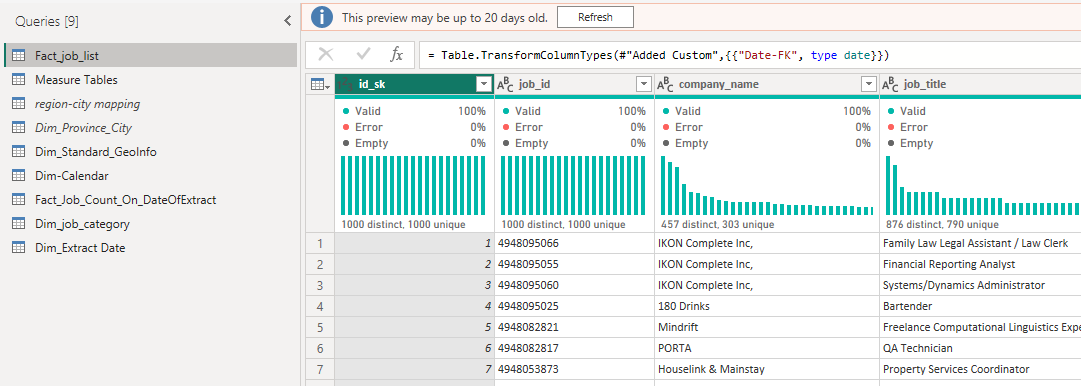
The descriptions of some of the queries (tables):
Fact_job_list: a fact table containing the job records extracted from SQL Server
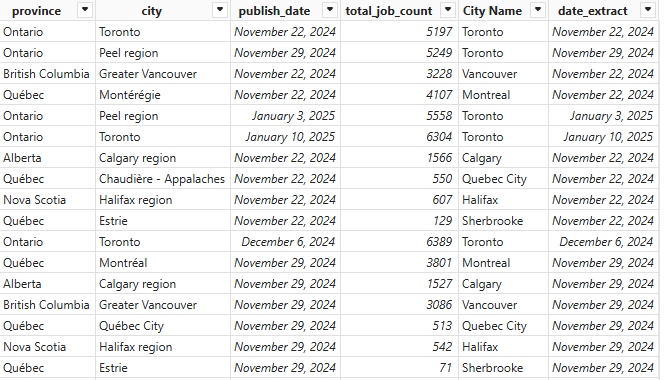
Fact_Job_Count_On_DateOfExtract: a fact table with the total count of jobs on the date of extract. This is a copy of "Fact_job_list" where relevant columns were selected and then were "Group by" to get one record per city on each date of extract. I created this table to get a "verification" to see the total job count (not samples) on the date of extract, where each city must have only one value in total_job_count. If there are 2 or more, means at least a job record classified to a wrong city. Ex. say on 2024-11-22, there are 5197 total job vacancies in Toronto, so in original list any job record from Toronto should have total_job_count = 5197, if a record has another value, say 3228, then there will be 2 Toronto records, one with value 5197, another is 3228. but since Vancouver has total_job_count = 3228, this means at least a job record mis-classified to Vancouver, as shown below:
Dim_Calender: a dimension table with a calendar created in Power Query
Dim_Standard_GeoInfo: a dimension mapping table extracted from an Excel File on my local PC which stores a list of cities and provinces in Canada
Dim_Extract Date: a dimension table extracted from an Excel file on my local PC, where the date of extract was saved started from 2024-11-22, the interval is 7.
This is a simple model I created with the "Cardinality" and "Cross-filter direction" settings:
This is the first report page I created (I cannot publish my work with free license in PBI Desktop, so I just took a screenshot - it's pretty sloppy):
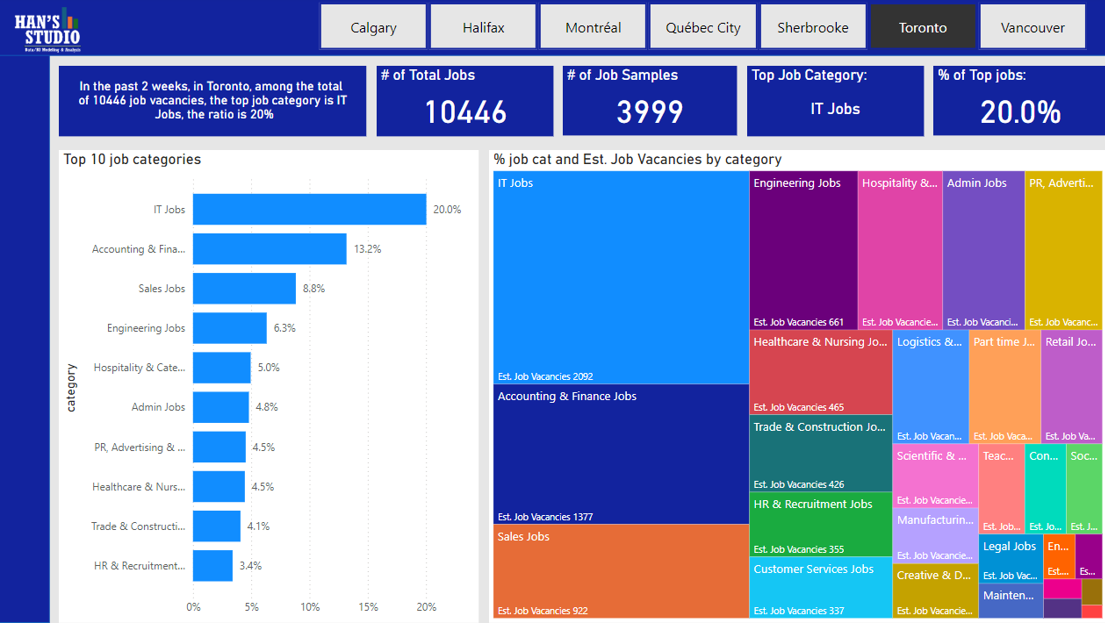
From the results, I can at least know as of 2024-11-29, in Toronto, there are 10446 vacancies in total in the past 2 weeks. Among the approximately 4000 samples I extracted, the most demanding job category is IT - accounting for approx. 20% (rounded). An estimated # of vacancy is 2092 (10446 × approx. 20%). The second one is accounting & finance (approx. 13.2%), est. # of vacancy is 1377 (10446 × approx. 13.2%). And so on so forth ...
Phew! Till now, I've got some results finally, but still, it's pretty much a skeleton, the flesh will need to be filled after all. As I said ealier, it's a "trail and error" process, there must be problems, errors or mistakes that I haven't noticed yet - they could be exposed as I accumulate more data (or I'm more mature), and will be fixed in version 2, 3 ...
This post will be kept updating.
2025.01.10 - Update PBI report page: add 2 charts and a drill through page
2025.02.04 - Some job records are miscategorized by Adzuna, (I saw some education related jobs are categorized into IT), I will try to figure that out.
Check out the code and PBI report on my GitHub repo!
References:
[1] Adzuna API (https://developer.adzuna.com/overview)
[2] RedHat (https://www.redhat.com/en/topics/api/what-is-a-rest-api)
[3] Microsoft Learning (https://learn.microsoft.com/en-us/training/powerplatform/power-bi)